Direct answer
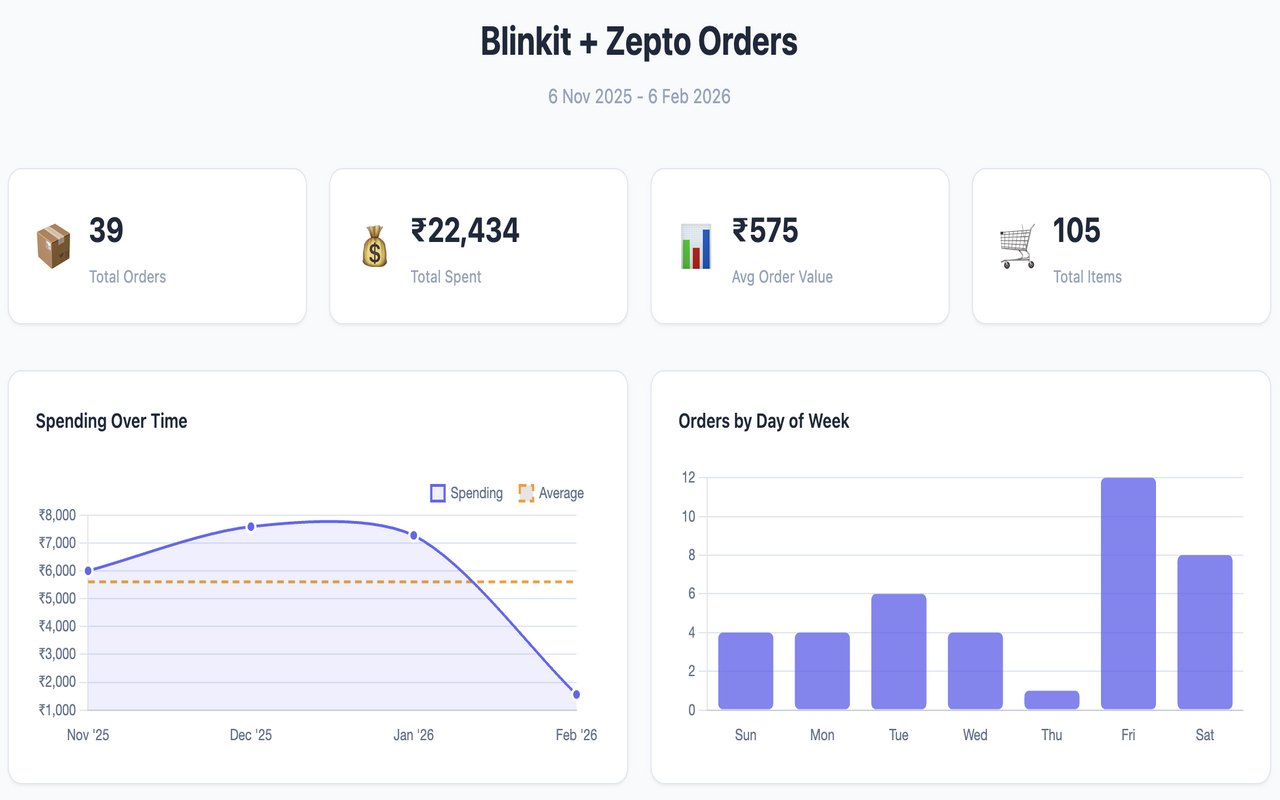
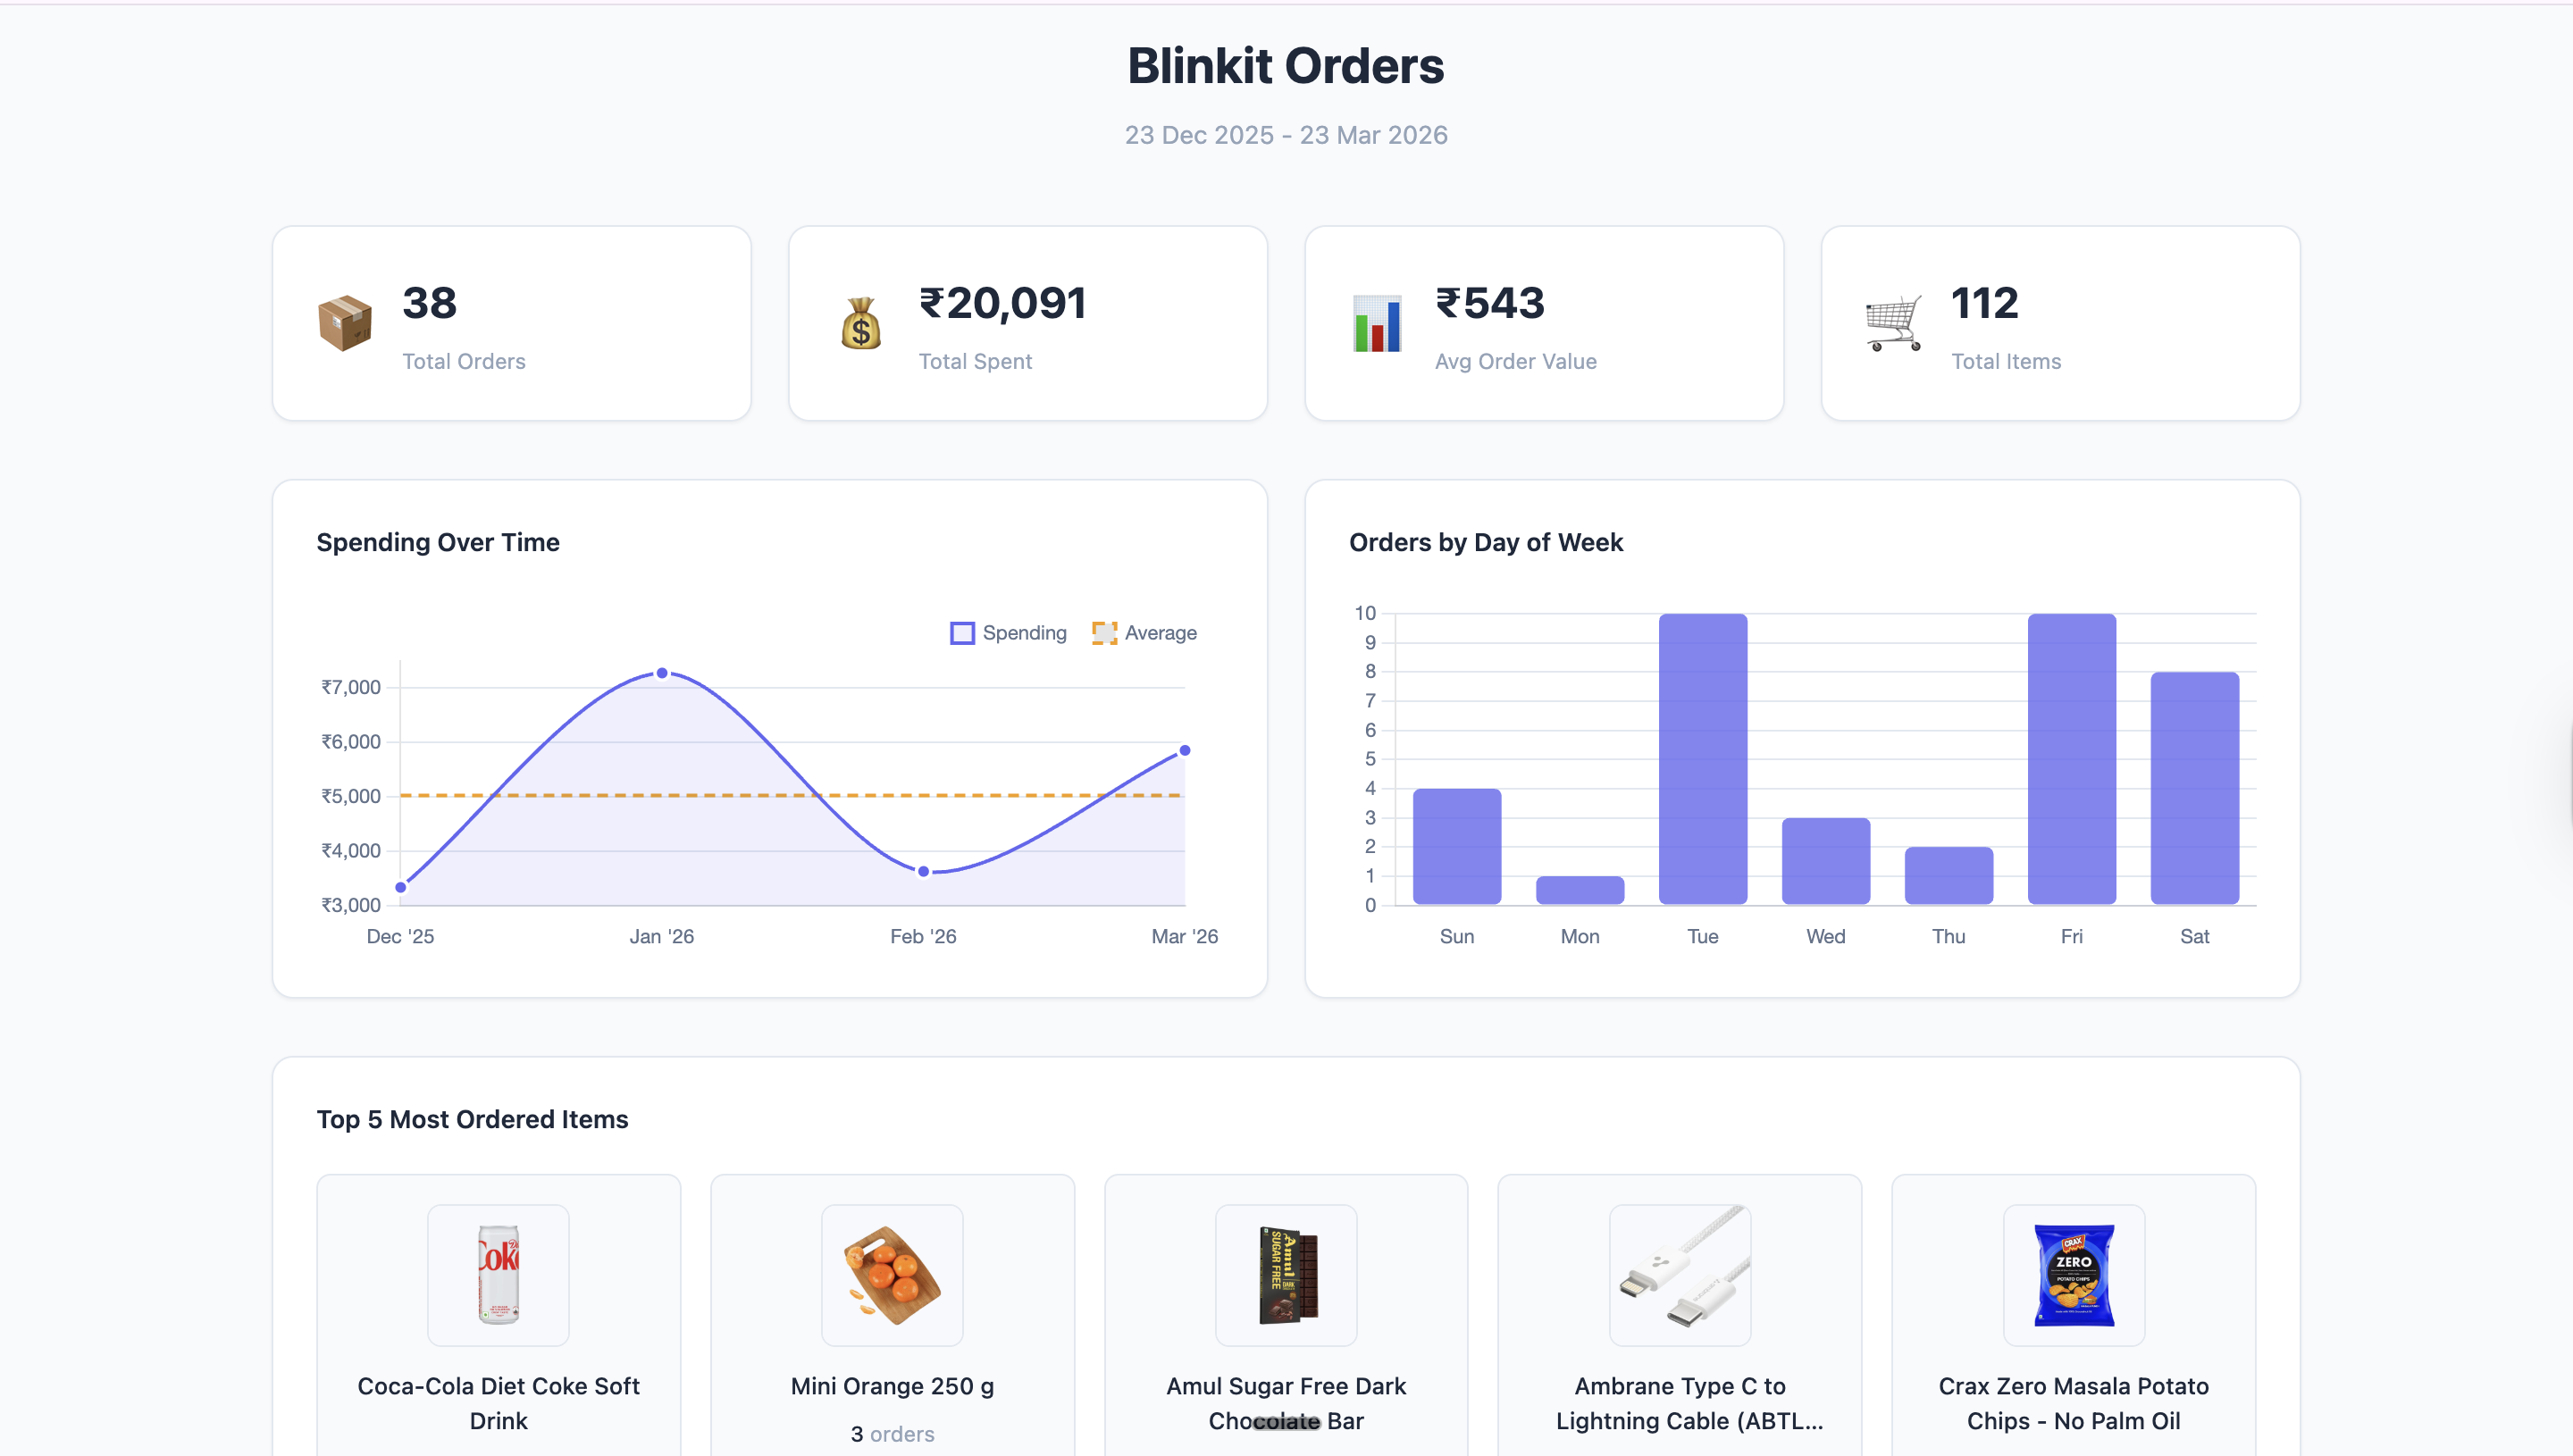
Generate a Blinkit report, then read total spend in the dashboard
The useful part is not just the number. The same view also shows order count, average basket size, repeat orders, and quick-commerce timing.
To check total money spent on Blinkit, open Shoplytics, select Blinkit, choose the date range you want to inspect, and click “Generate Report.” The dashboard then shows total spend, order count, basket size, and repeat quick-commerce patterns in one place.
The useful part is not just the number. The same view also shows order count, average basket size, repeat orders, and quick-commerce timing.
Choose the date range before you generate the report. The dashboard uses that range when it calculates total spend.
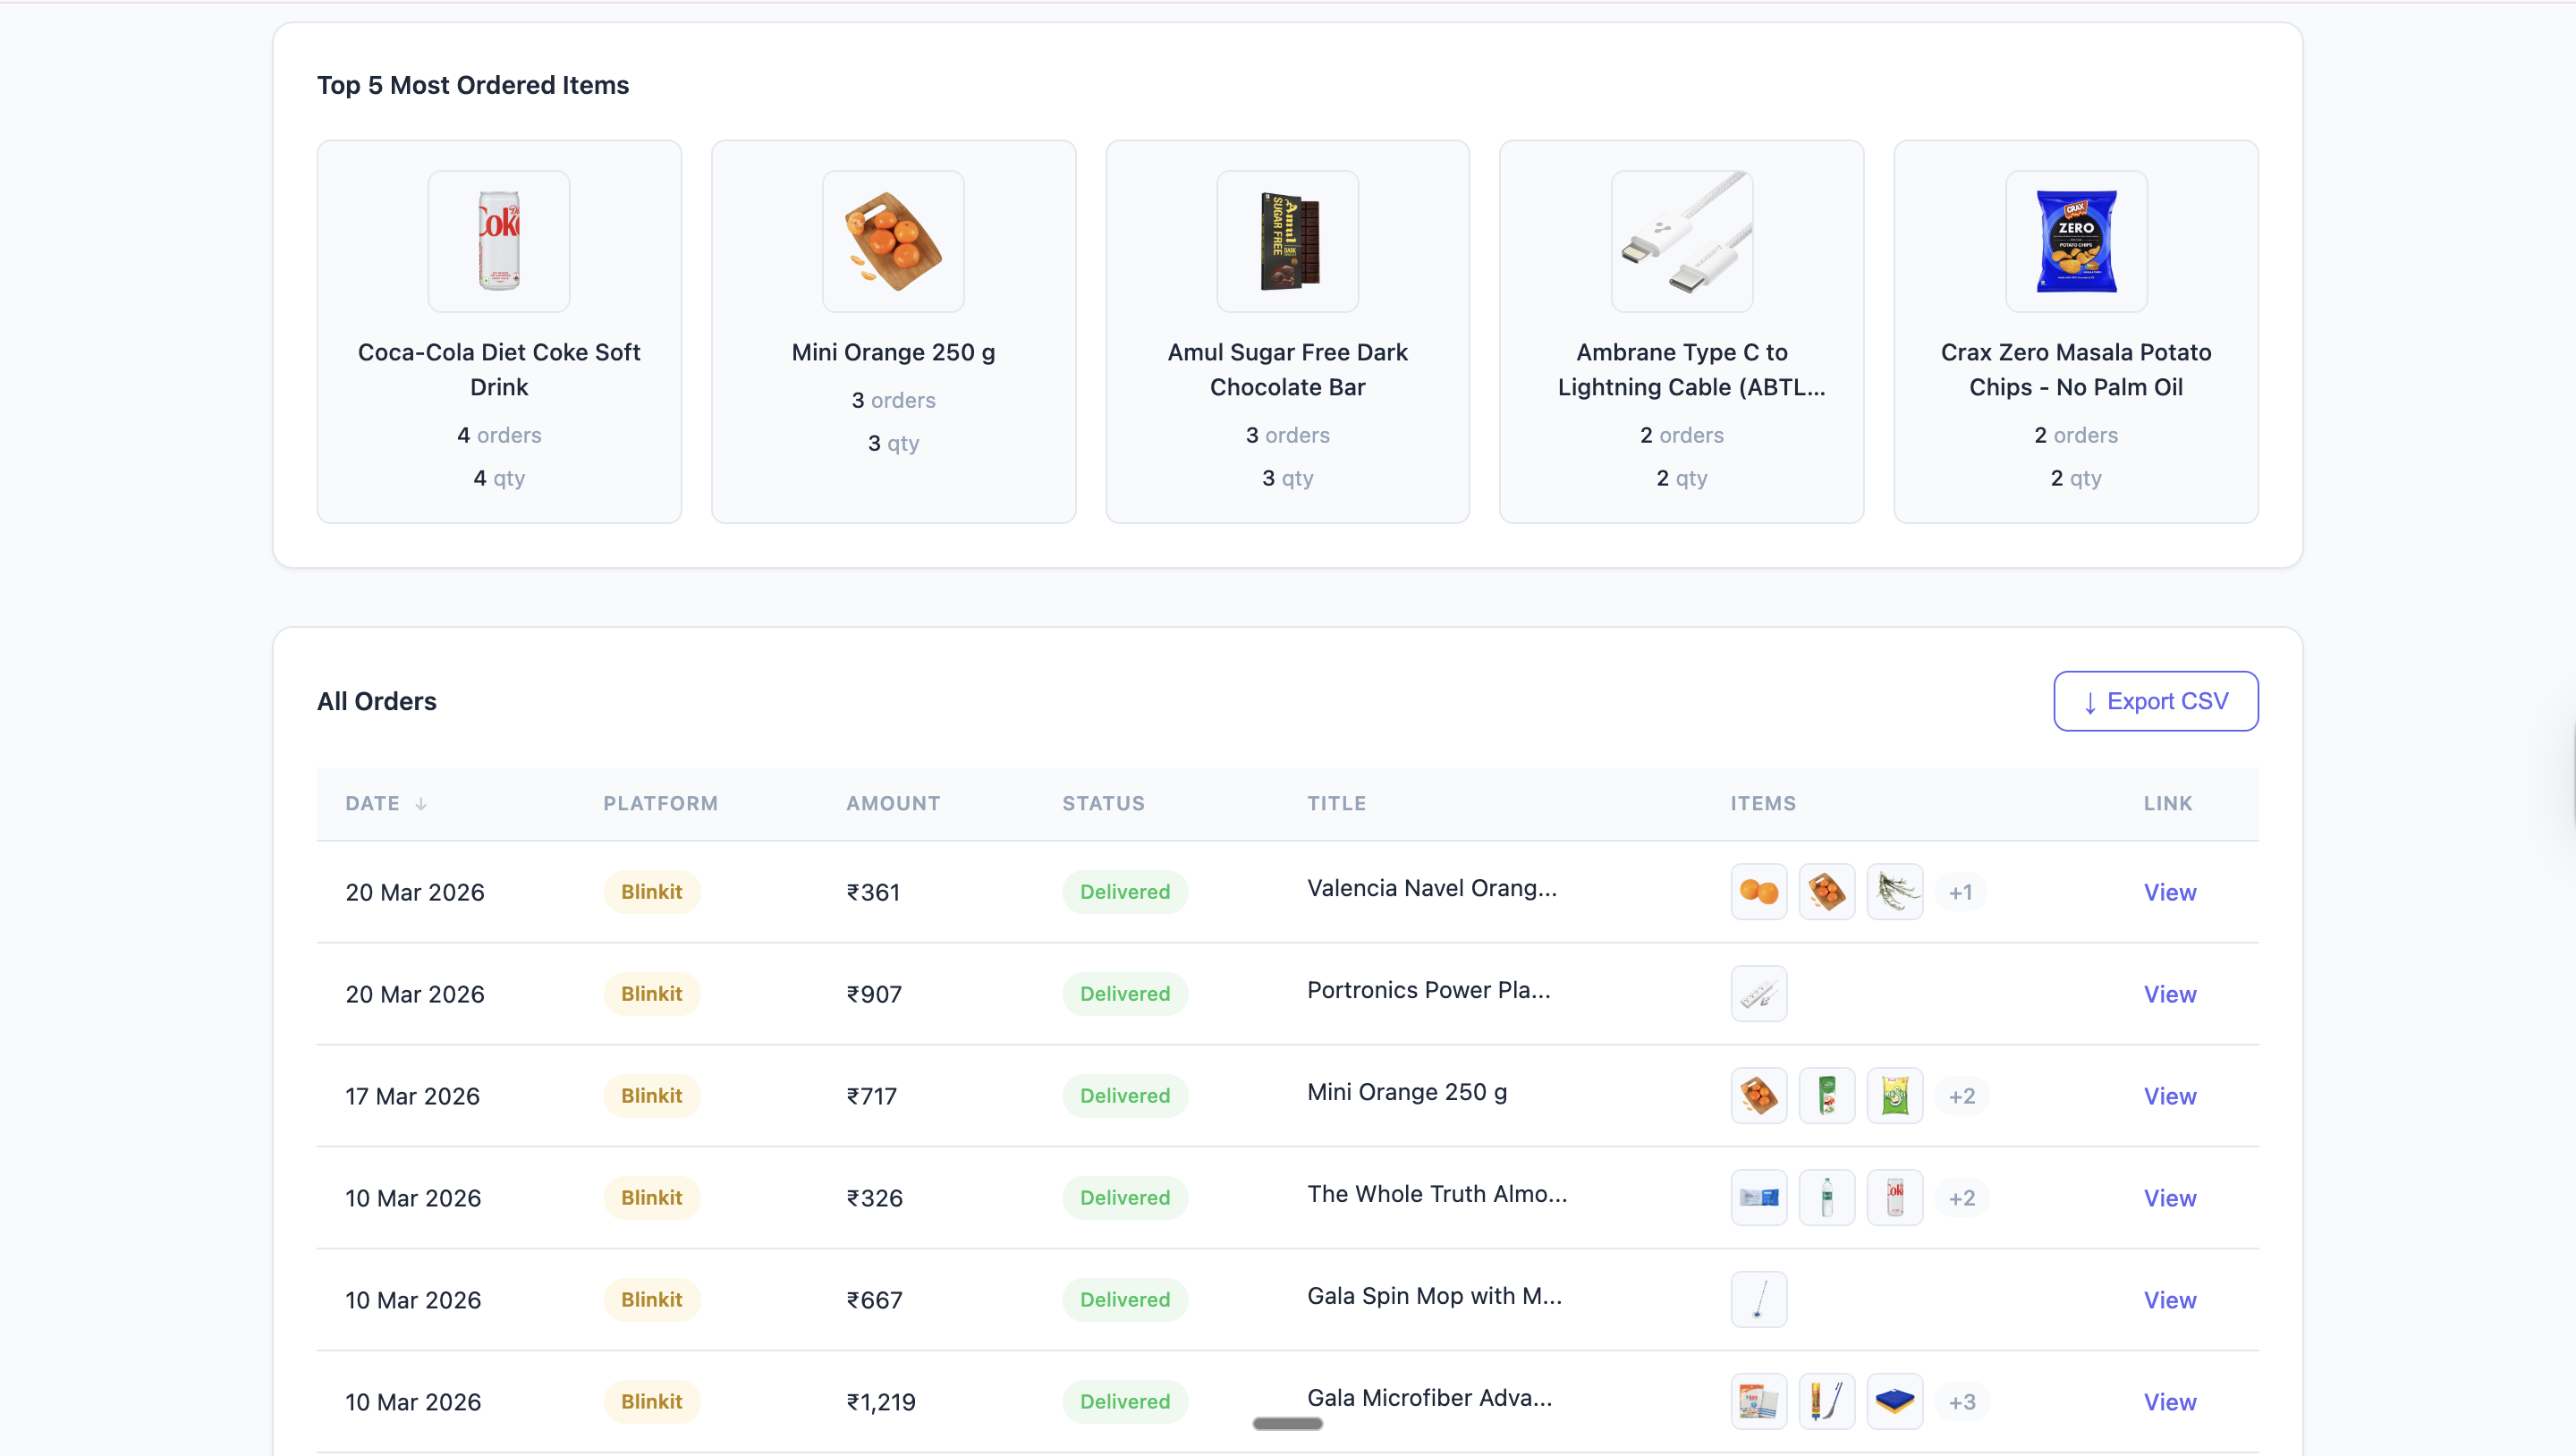
Yes. Shoplytics reads the order history and turns it into totals and patterns, so you do not have to add orders by hand.
No. The current product model is local-first. All shopping data stays on your device.